
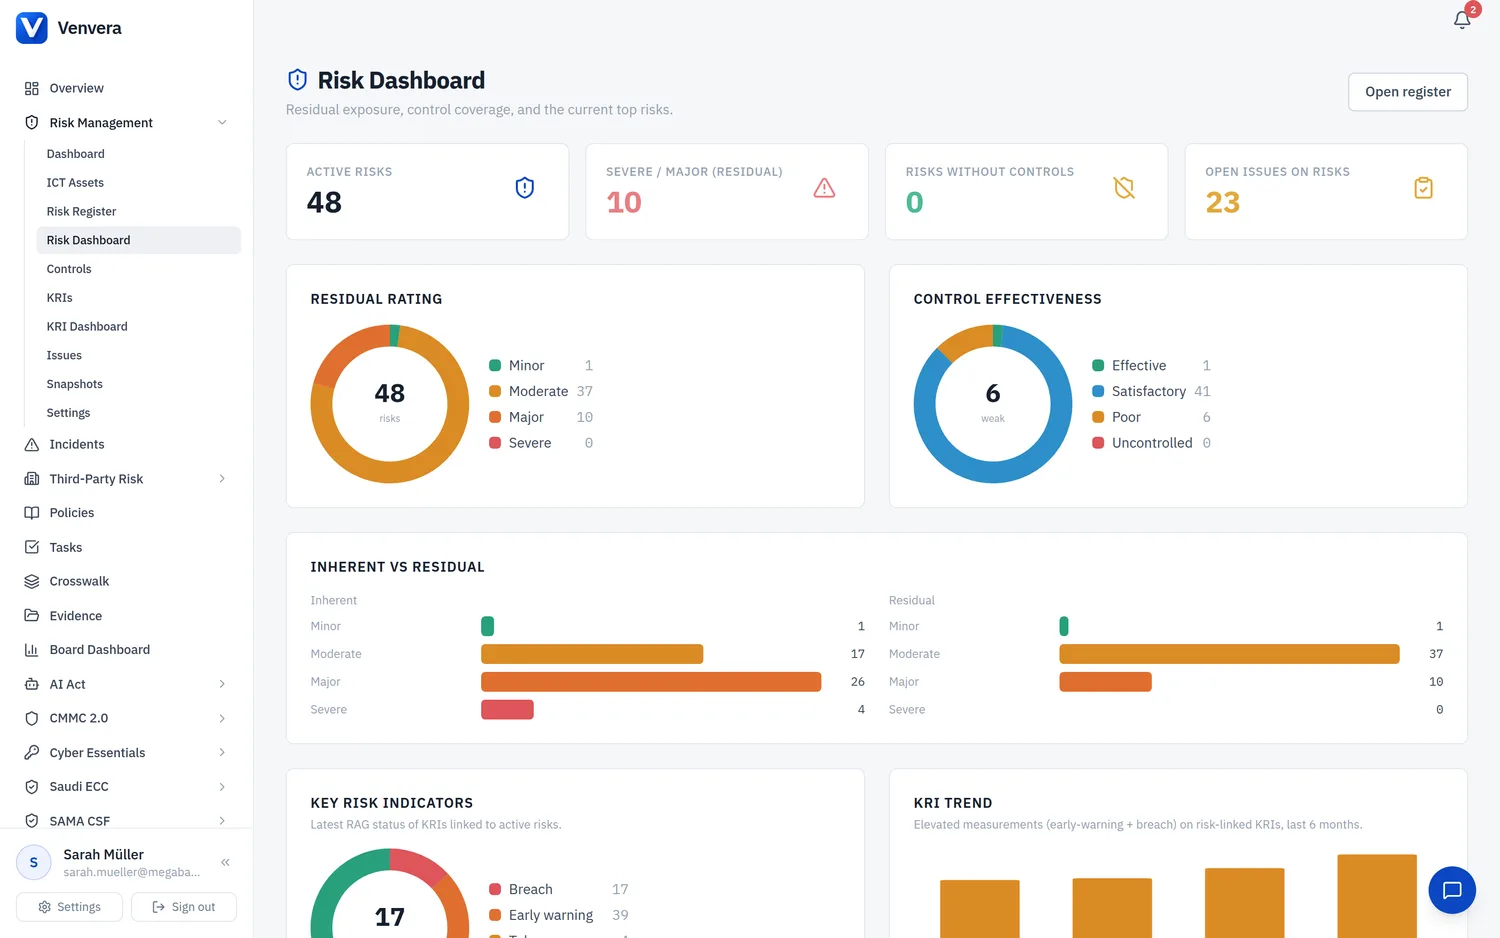
The KRI Dashboard is the portfolio view of your Key Risk Indicators: a single screen that answers "where are we breaching, who has not reported, and how is each part of the business doing." It complements the KRI list (which is for managing individual indicators) with an at-a-glance monitoring view. Find it under Risk → KRI Dashboard in the sidebar.
What the dashboard shows
| Panel | What it tells you |
|---|---|
| Latest RAG status | The current red / amber / green band of every KRI based on its most recent measurement, so breaches and early warnings stand out immediately. |
| Elevated measurements | The KRIs currently sitting in a warning or breach band, surfaced together for action. |
| Reporting health | How current your data is: which KRIs have a fresh measurement for the period and which are stale. |
| Update-request cycle | The state of the measurement requests you have sent to owners: how many are outstanding, submitted, or expired. See Requesting measurements from owners. |
| KRIs by department | A breakdown of indicator health across departments, so you can see which part of the organisation needs attention. |
Use the dashboard at your monthly risk committee: open with the RAG status for the headline, drill into elevated measurements for the discussion, and use reporting health and the update-request cycle to chase any owners who have not yet submitted.