
Risk Management end to end: residual exposure on the dashboard, the register beneath it, KRIs with their own appetite thresholds, and snapshots that freeze the register in time. (56 seconds)
The Risk Management module provides a comprehensive framework for identifying, assessing, treating, and monitoring risks across every domain the organisation owns - ICT and cyber, regulatory and compliance, operational, financial crime / AML, strategic and business, conduct and reputation, fraud, third-party and concentration, and ESG / climate risk. It works against every framework you enable in Venvera (DORA, NIS2, ISO 27001, GDPR, SOC 2, NIST CSF, EU AI Act, AMLD, PCI DSS, HIPAA, CMMC, UAE IA and more) and includes a visual dashboard for executive oversight, a detailed risk register, and configurable risk appetite settings.
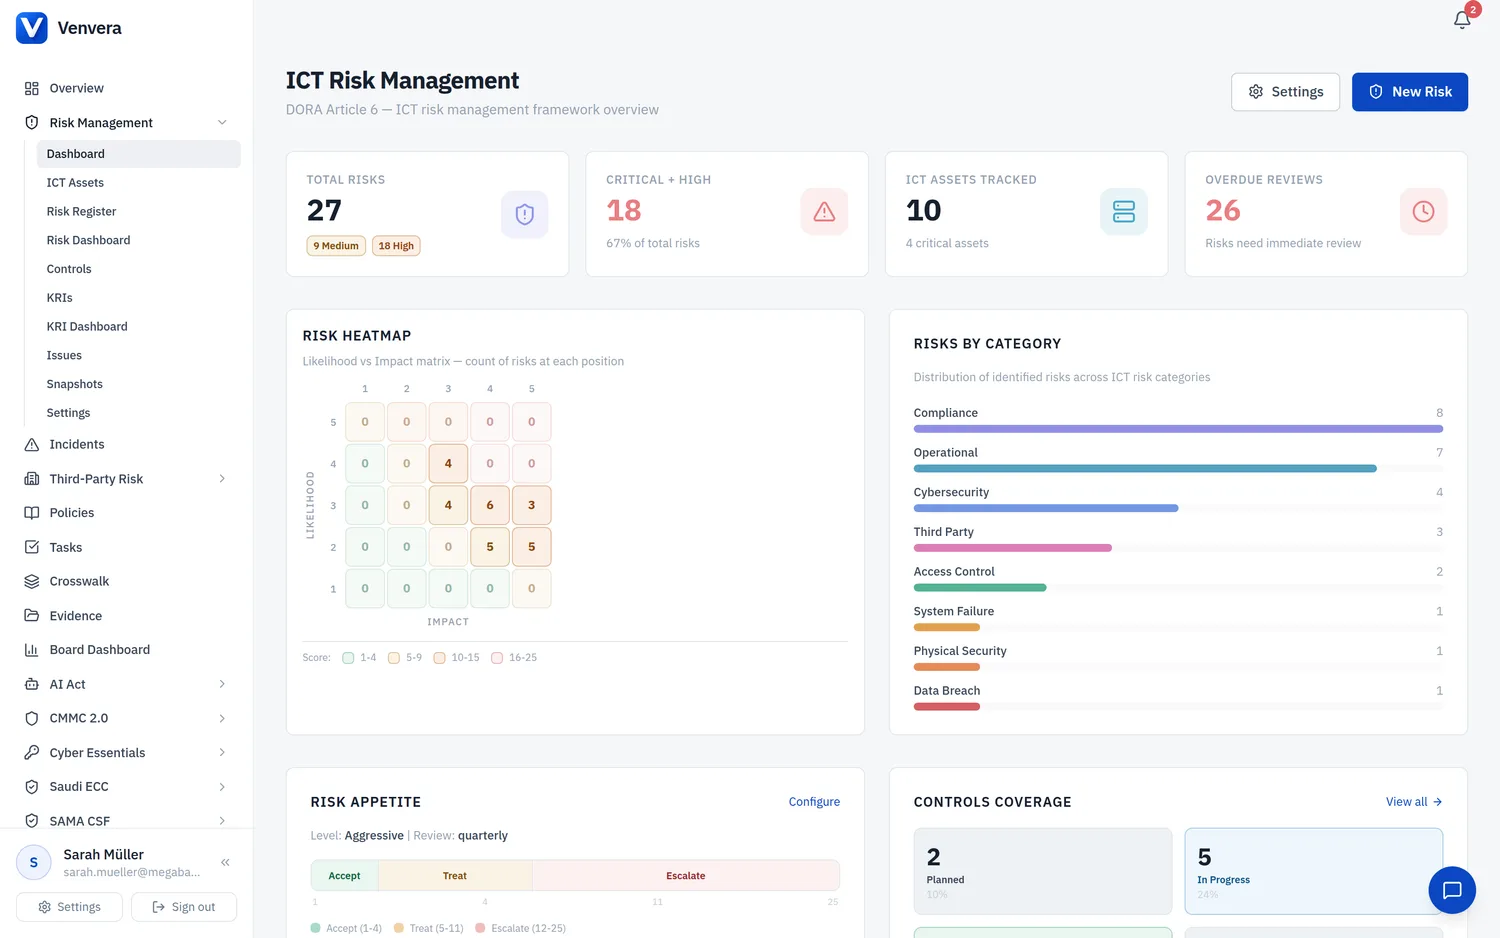
Risk Dashboard
The dashboard provides an executive-level overview of your organization's ICT risk posture through interactive visualizations and summary statistics.
Summary Stat Cards
| Card | Content |
|---|---|
| Total Risks | The total count of all risks in the register, with a breakdown by risk level: Critical, High, Medium, and Low counts displayed beneath. |
| Critical + High | The combined count of Critical and High level risks, along with the percentage this represents of all risks. This highlights your most urgent risk exposure. |
| ICT Assets Tracked | The total number of ICT assets in the asset register, with the count of assets classified as Critical shown separately. |
| Overdue Reviews | The number of risks whose Next Review Date has passed without an updated review. These require immediate attention. |
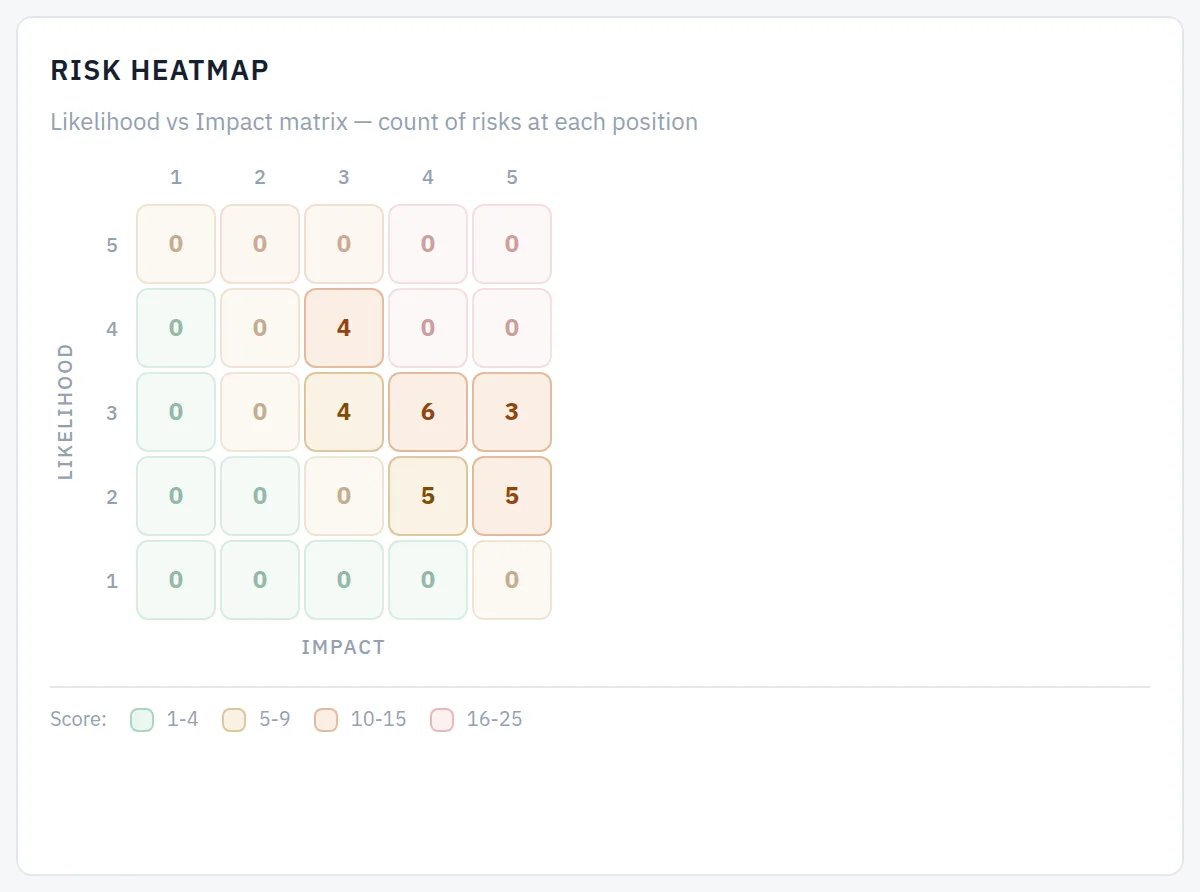
Risk Heatmap
A 5x5 matrix with Impact (1-5) on the X-axis and Likelihood (5-1, top to bottom) on the Y-axis. Each cell displays the count of risks falling at that intersection of likelihood and impact. Cells are color-coded by the calculated risk score (Likelihood x Impact):
| Score Range | Color | Level |
|---|---|---|
| 1 - 4 | Emerald / Green | Low |
| 5 - 9 | Amber / Yellow | Medium |
| 10 - 15 | Orange | High |
| 16 - 25 | Red | Critical |
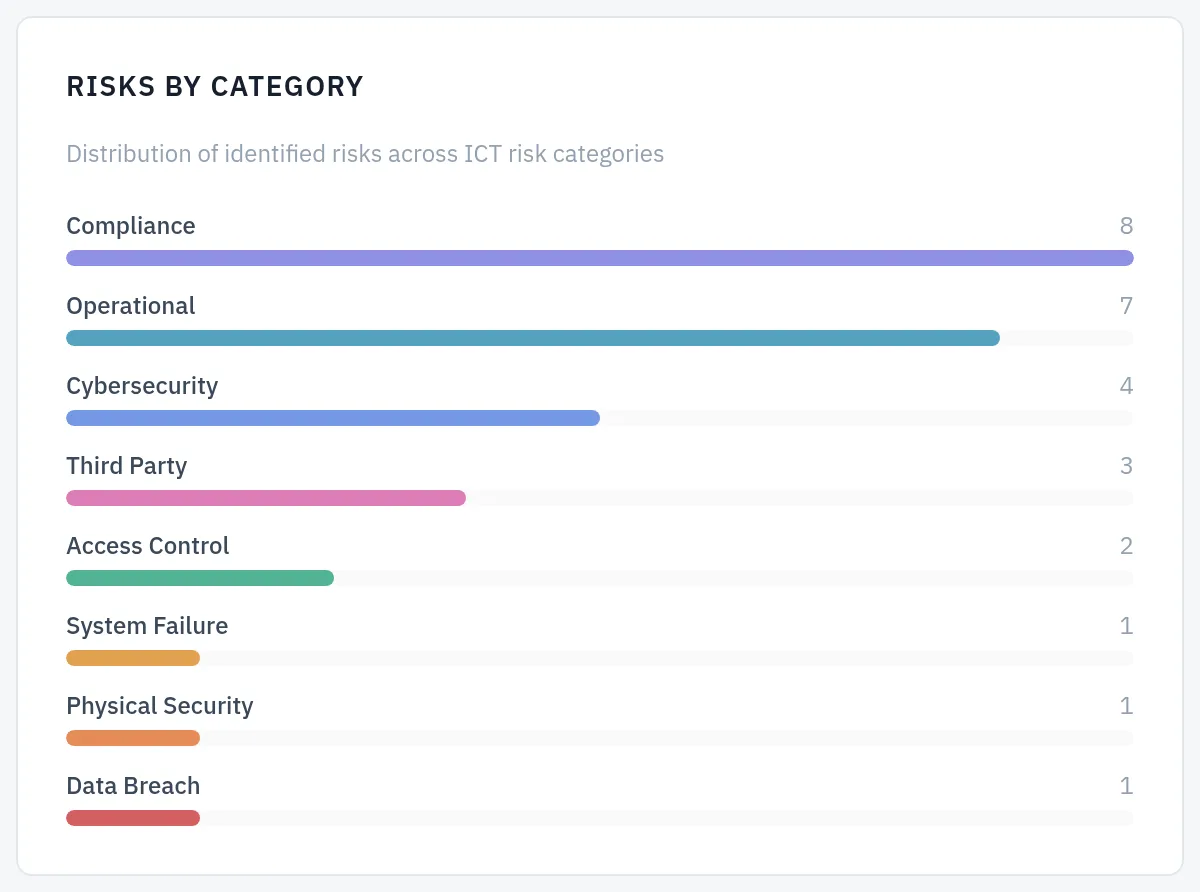
Risk Distribution by Category
A horizontal bar chart showing how many risks exist in each category (Cybersecurity, Data Breach, System Failure, Third Party, etc.). The bars are proportionally sized so you can quickly see which risk categories dominate your register.
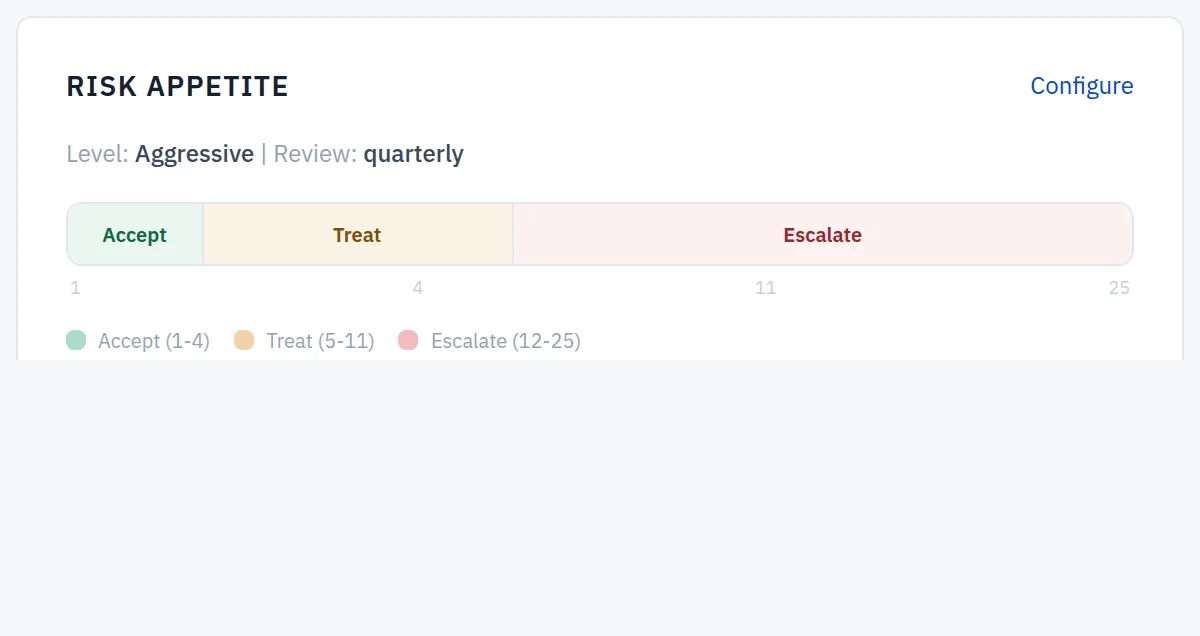
Risk Appetite Indicator
Displays the organization's current risk appetite level (Conservative, Moderate, or Aggressive) along with the configured acceptance and escalation thresholds. This provides context for interpreting risk scores against the organization's stated tolerance.
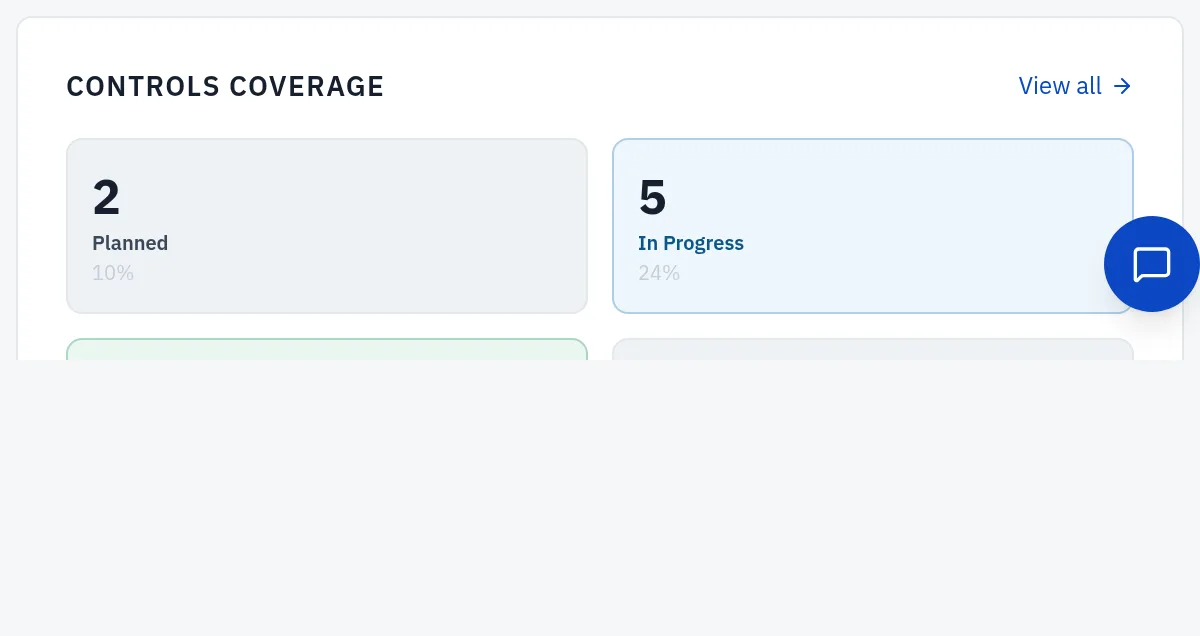
Controls Coverage
A grid visualization showing how ICT controls map to risk categories, helping you identify areas with strong control coverage and gaps that need attention.
Top 10 Risks
A ranked table of the ten highest-scoring risks in the register, sorted by inherent risk score descending. This provides a quick view of the most critical risks that require management attention.
Explore the Risk Management module
- Risk Register and assessing risks - the working register plus the full risk assessment form.
- Key Risk Indicators (KRIs) - early-warning metrics anchored to regulatory articles, with breach clocks and the KRI Dashboard.
- ICT Asset Management - the DORA Article 8 asset inventory.
- ICT Controls - the control catalogue and its regulatory mappings.
- Risk Appetite Settings - tolerance levels and the acceptance and escalation thresholds.
- Risk Snapshots and Board Pack - point-in-time captures and the board-ready PDF.
- Issues and Remediation Actions - tracking weaknesses and findings to closure.